Graphing Worksheets
Updated October 2026 · 10 free printables
Data and graphing worksheets for kindergarten to 3rd grade: count pictures and color a picture graph, make tally charts, read bar graphs, turn a tally chart into a bar graph, read and draw pictographs with a key, and work with a scale of 5 or with half pictures.
Each page has its own data set (fruit, pets, weather, bugs, books, sports, ice cream flavors, a food drive and a bake sale) and its own kind of graph, with questions like 'how many more' and 'how many in all'. Answer keys included.
All 10 Graphing Worksheets, One by One
Here is a closer look at every page in this collection: what it practices, which grade it fits and a tip for each one. 4 of them belong to a smaller theme and are described there instead.
-
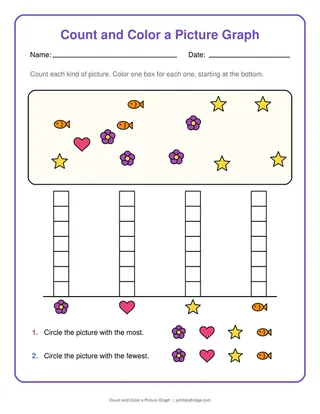
1. Count and Color a Picture Graph
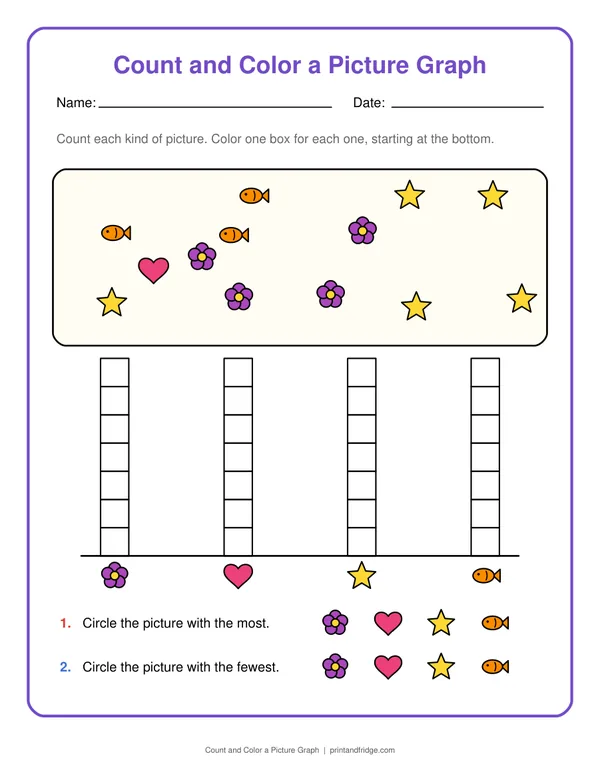
A free printable count and color a picture graph worksheet with an answer key. Count each kind of picture. Color one box for each one, starting at the bottom. It suits ages 4 to 6, and little ones can count the pictures with a finger.
-
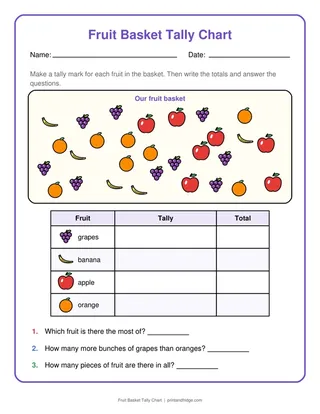
2. Fruit Basket Tally Chart
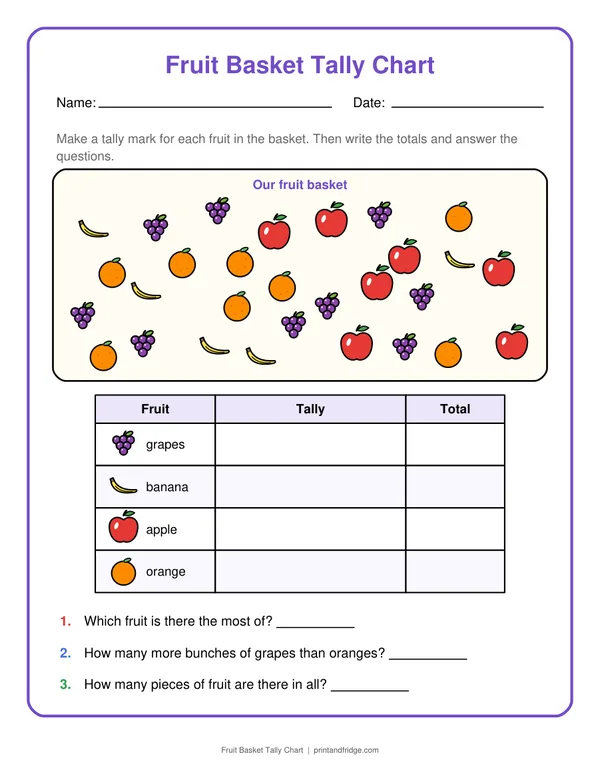
A free printable fruit basket tally chart worksheet with an answer key. Make a tally mark for each fruit in the basket. Then write the totals and answer the questions. First graders can do it on their own once they know the strategy at the top of the page.
-
3. Favorite Pets Bar Graph
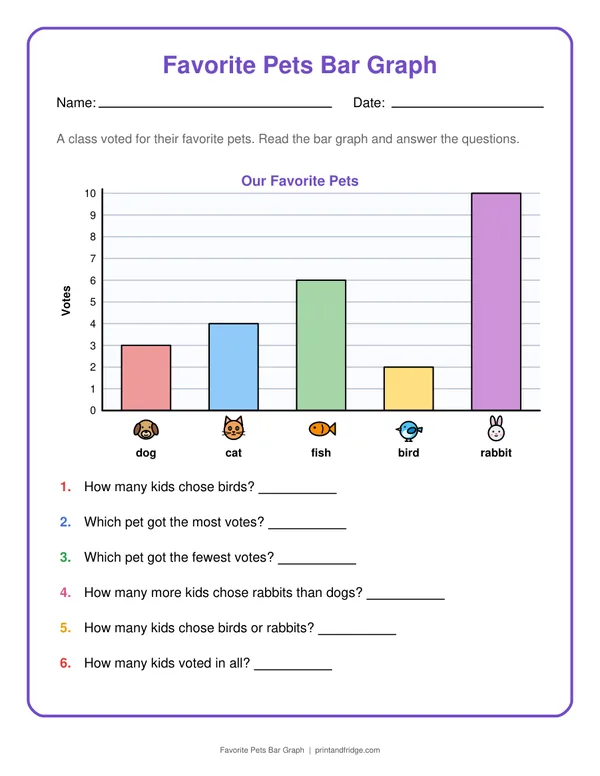
Download PDF + answer key · View page · More in Bar Graph Worksheets
-
4. Weather Tally to Bar Graph
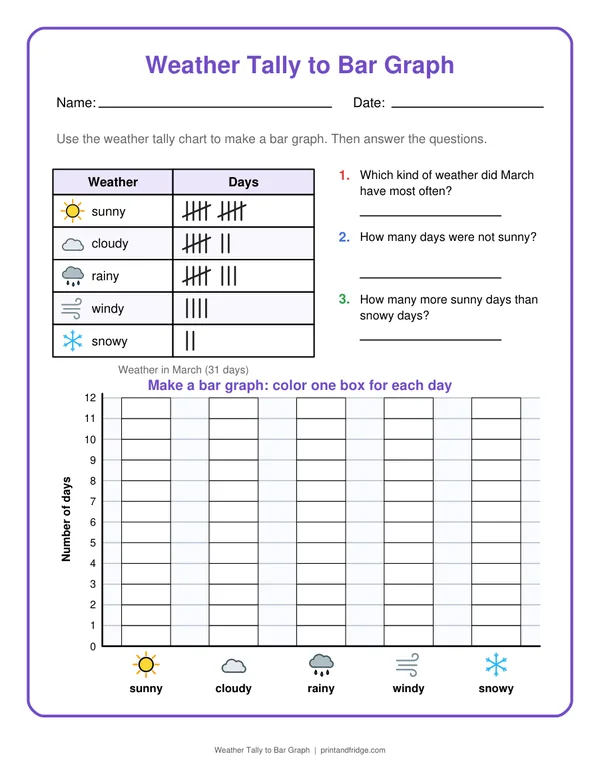
Download PDF + answer key · View page · More in Bar Graph Worksheets
-
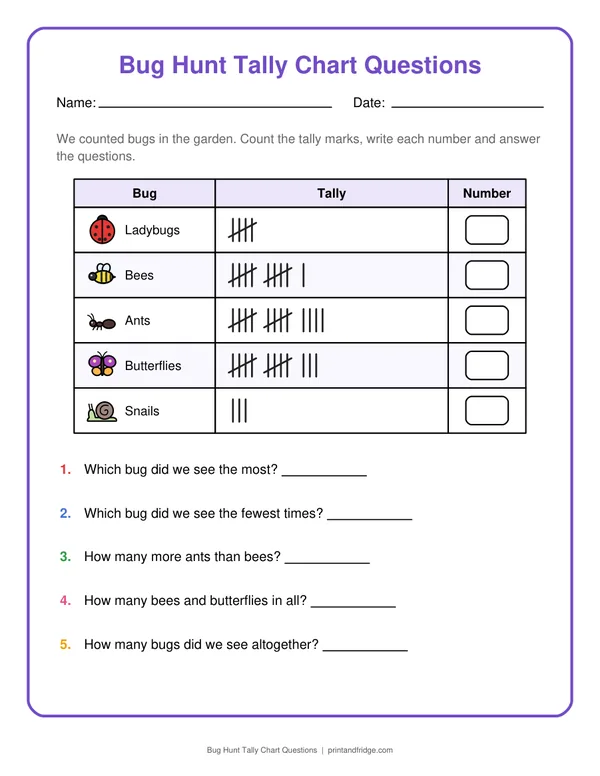
5. Bug Hunt Tally Chart Questions
A free printable bug hunt tally chart questions worksheet with an answer key. We counted bugs in the garden. Count the tally marks, write each number and answer the questions. It matches first grade goals, roughly ages 6 to 7.
-
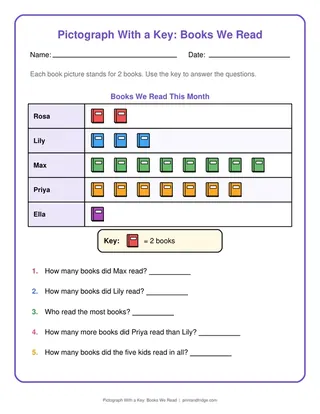
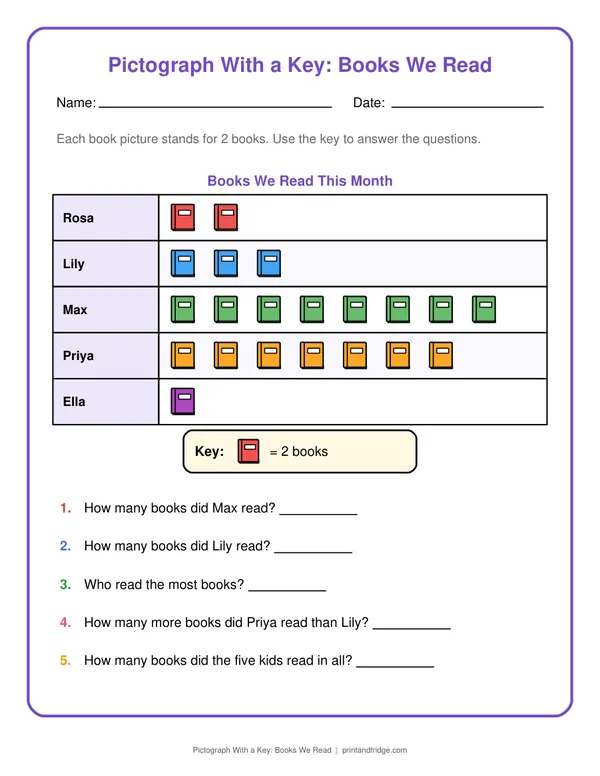
6. Pictograph With a Key: Books We Read
A free printable pictograph with a key: books we read worksheet with an answer key. Each book picture stands for 2 books. Use the key to answer the questions. Second graders usually finish it in 10 to 15 minutes.
-
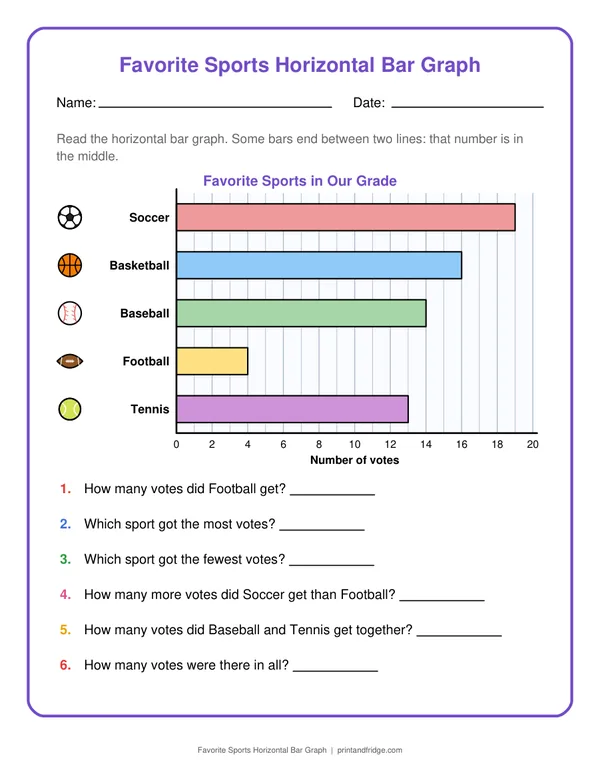
7. Favorite Sports Horizontal Bar Graph
Download PDF + answer key · View page · More in Bar Graph Worksheets
-
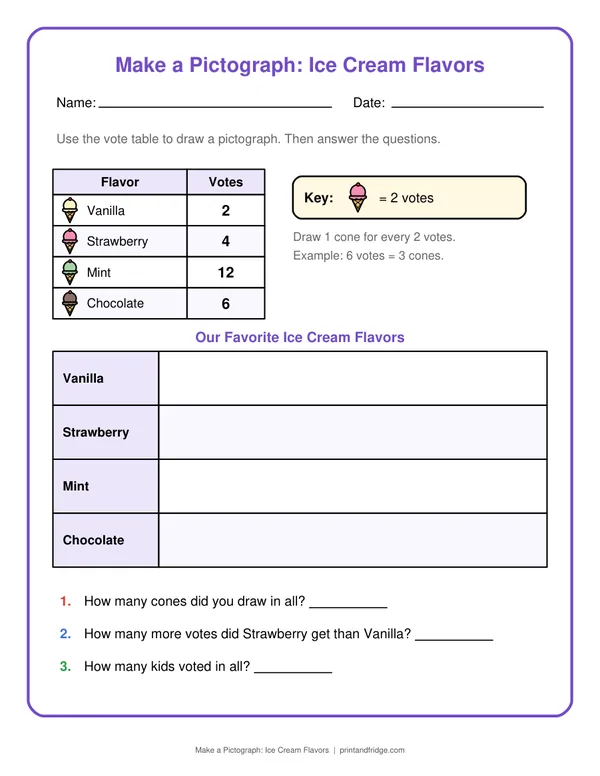
8. Make a Pictograph: Ice Cream Flavors
A free printable make a pictograph: ice cream flavors worksheet with an answer key. Use the vote table to draw a pictograph. Then answer the questions. Second graders usually finish it in 10 to 15 minutes.
-
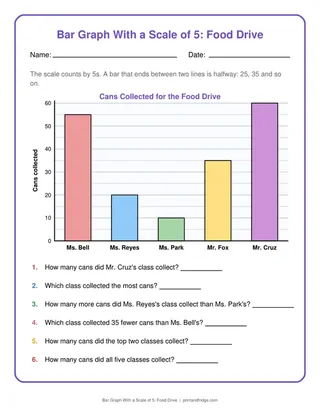
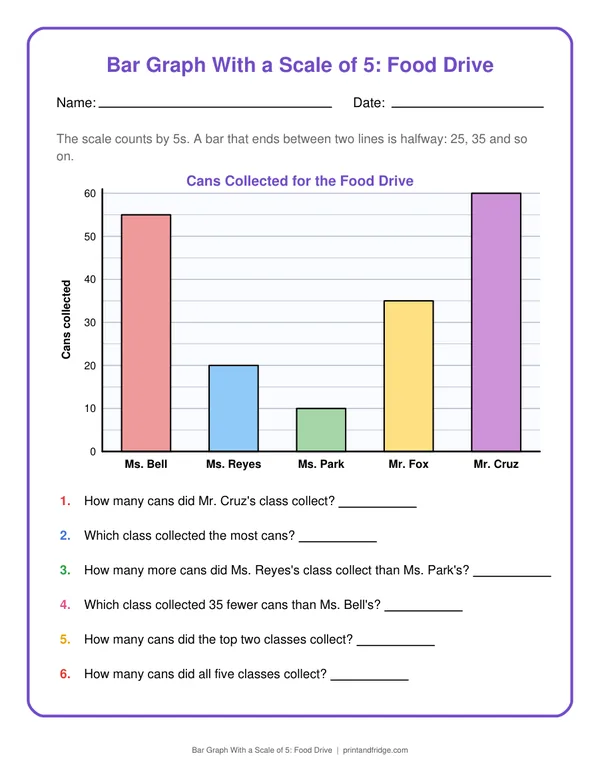
9. Bar Graph With a Scale of 5: Food Drive
Download PDF + answer key · View page · More in Bar Graph Worksheets
-
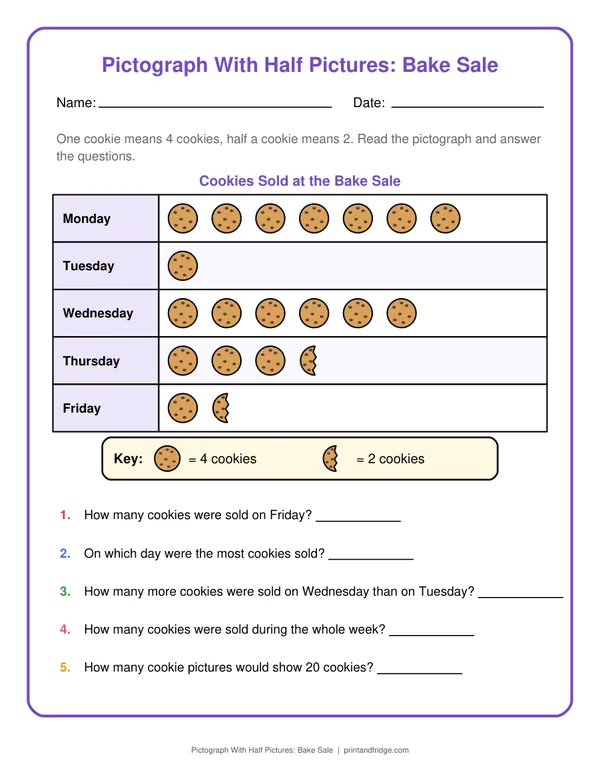
10. Pictograph With Half Pictures: Bake Sale
A free printable pictograph with half pictures: bake sale worksheet with an answer key. One cookie means 4 cookies, half a cookie means 2. Read the pictograph and answer the questions. It is aimed at third grade, around ages 8 to 9.
Tips for graphing worksheets
- Cross out each picture as you count it, so nothing is counted twice.
- Read the key of a pictograph before anything else: one picture may stand for 2, 4 or more.
- Check a bar graph by adding all the bars; the total should match the number of votes or days.
Fun math facts
- The Scottish engineer William Playfair published some of the first bar graphs in 1786.
- In China, Japan and Korea people often tally with the character 正, which has exactly five strokes.
- Florence Nightingale used colorful diagrams in the 1850s to show that more soldiers died of disease than of wounds.
Fun ways to use your printables
- Ask everyone at dinner a question, keep tally marks, and draw the bar graph together.
- Graph the weather for a month on a calendar, then compare it with the March weather page.
- Sort a handful of snack crackers or buttons by color and make a picture graph before eating or putting them away.
How to print
Click Download PDF and print at 100% on US Letter or A4 paper. Page 1 is the worksheet and page 2 is the answer key, so choose “page 1” in the print dialog if you only want the practice page. Every worksheet is free for home, homeschool and classroom use, so print as many copies as you need.
Frequently asked questions
What is the difference between a picture graph and a pictograph?
In a picture graph each picture is one thing. In a pictograph a key tells you what one picture is worth, like 1 book = 2 books, so kids have to skip count to read it.
How do tally marks work?
Draw one line for each thing you count. The fifth line goes across the first four, so you can count the groups by 5s and then add the leftover lines.
When do kids learn bar graphs?
Kids sort and count in kindergarten, read and make simple graphs in 1st and 2nd grade, and use scales of 2, 5 or 10 and pictographs with keys in 3rd grade.
How can I make graphing hands-on?
Run a real survey: ask family members their favorite fruit, make tally marks, then build the bar graph on the worksheet with the same numbers.