Horizontal Bar Graph: Vehicles We Counted
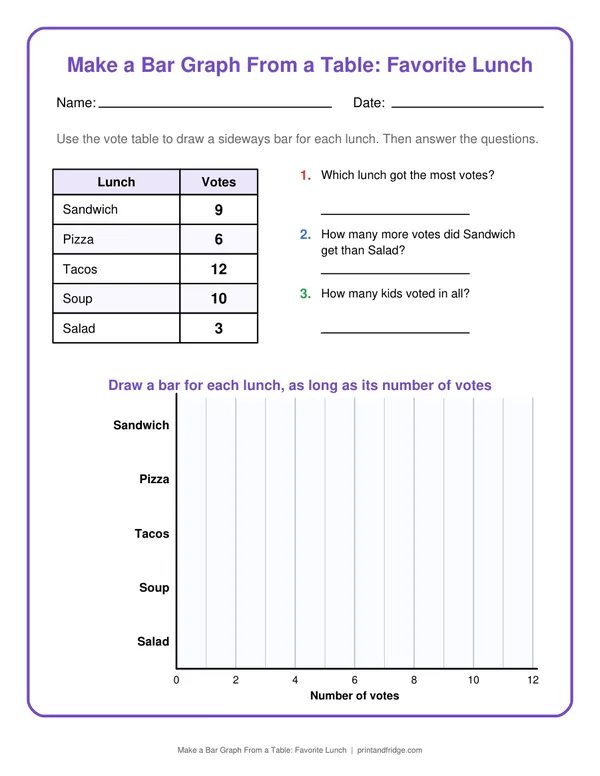
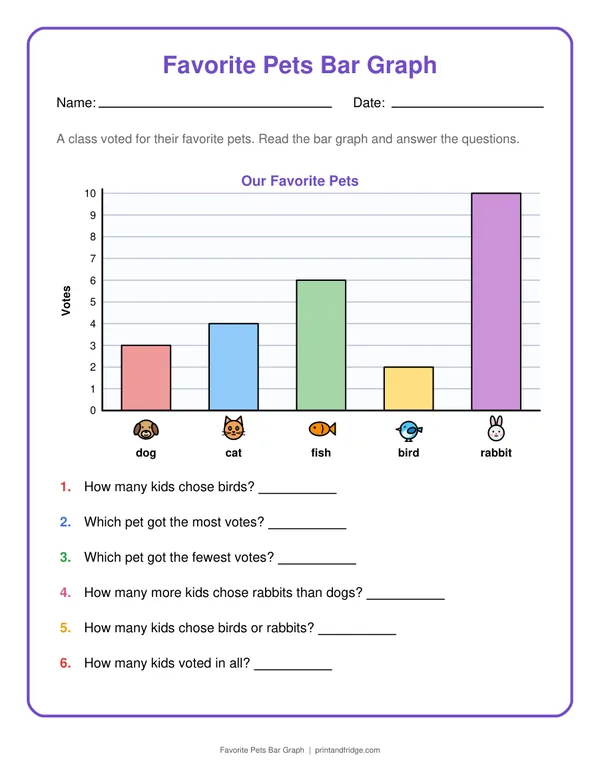
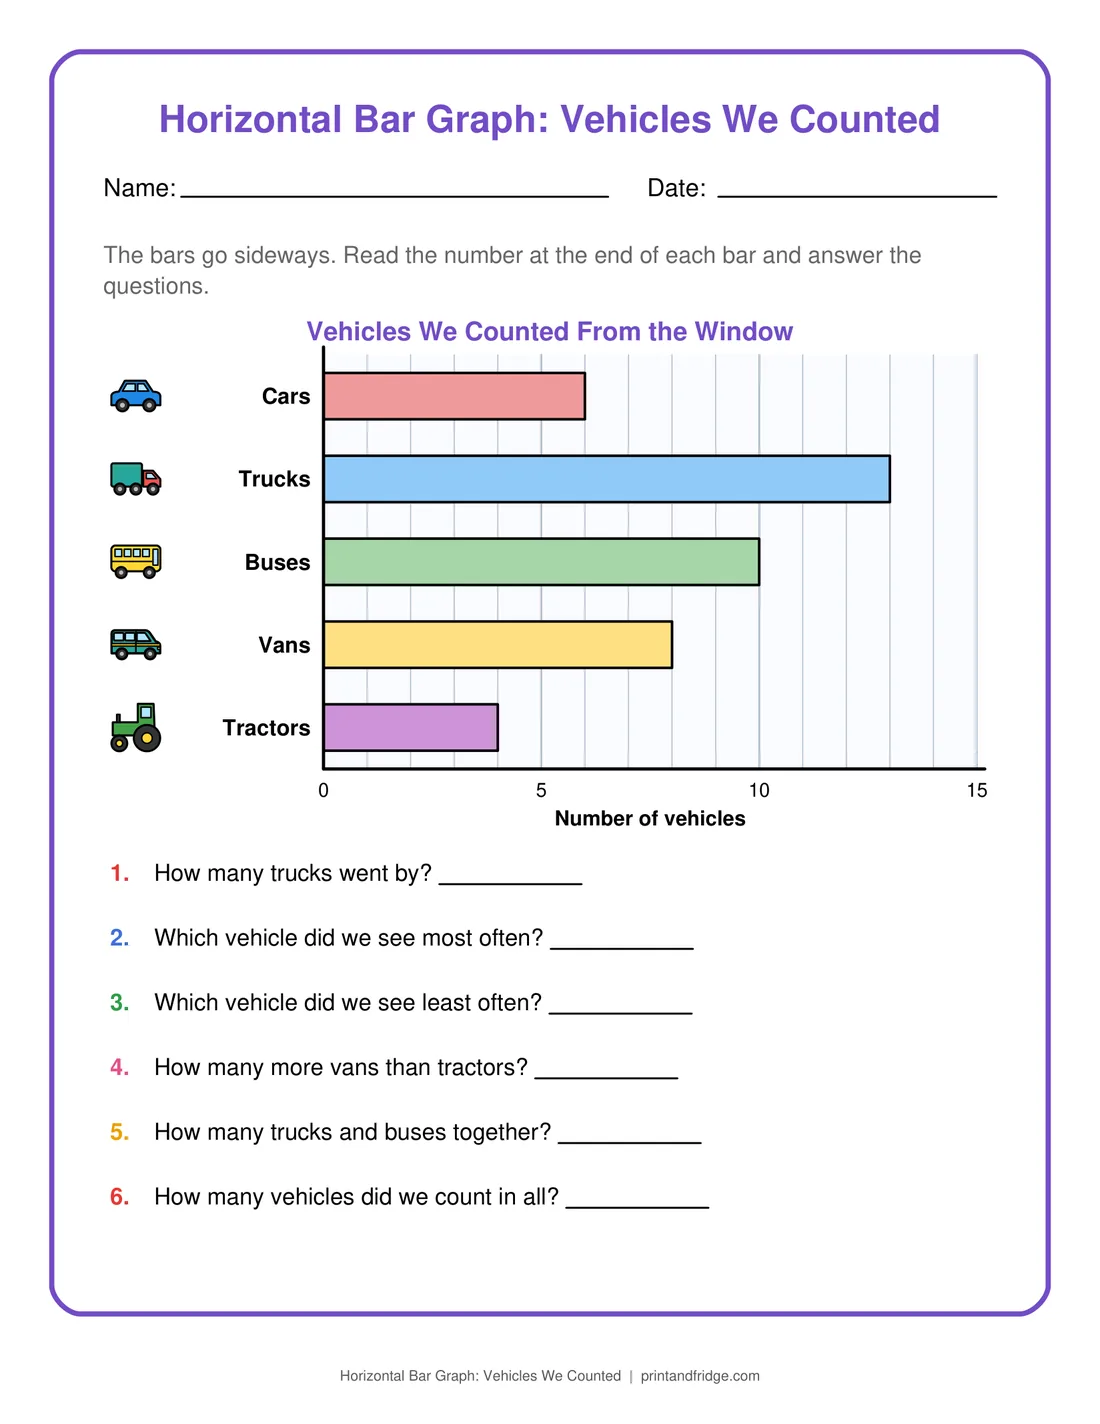
A horizontal bar graph of cars, trucks, buses, vans and tractors counted from a window, scale of 1 with labels every 5. Six questions ask for single bars, most and least, differences and the total.
- Size
- US Letter (8.5 × 11 in), fits A4
- 2 pages: the worksheet and its answer key
- Level
- Grade 2
- License
- Free for personal & classroom use
About this worksheet
A horizontal bar graph of cars, trucks, buses, vans and tractors counted from a window, scale of 1 with labels every 5. Six questions ask for single bars, most and least, differences and the total. Second graders usually finish it in 10 to 15 minutes.
On this sheet
questions. Vehicles We Counted From the Window Cars Trucks Buses Vans Tractors Number of vehicles How many trucks went by ___? Which vehicle did we see most often? Which vehicle did we see least often? How many more vans than tractors? How many trucks and buses together? How many vehicles did we count in all?...
Tips for using it
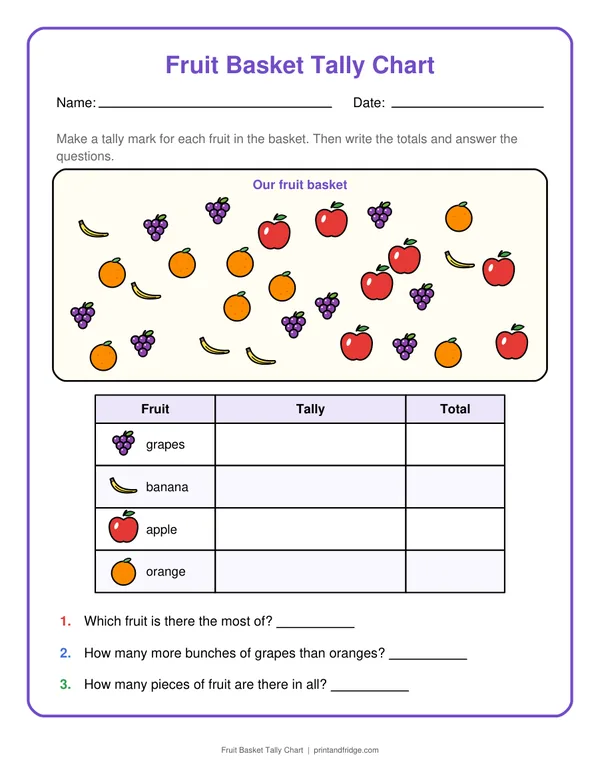
- Cross out each picture as you count it, so nothing is counted twice.
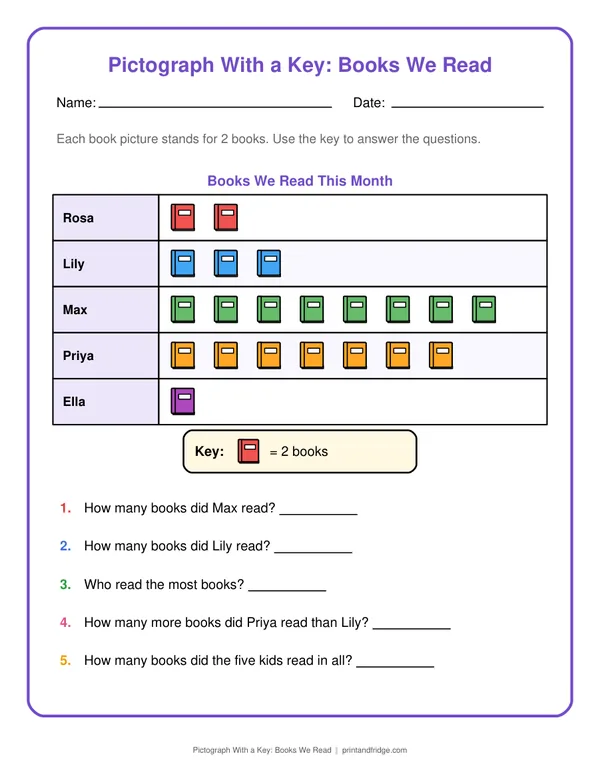
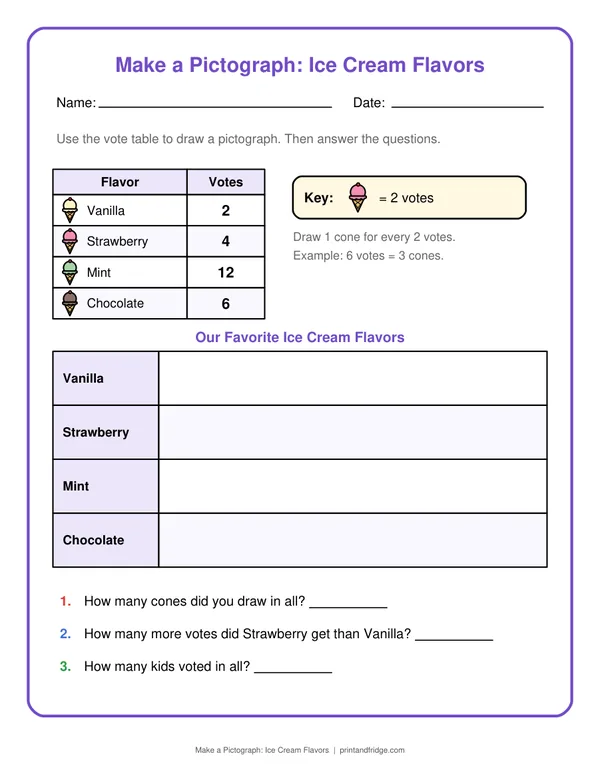
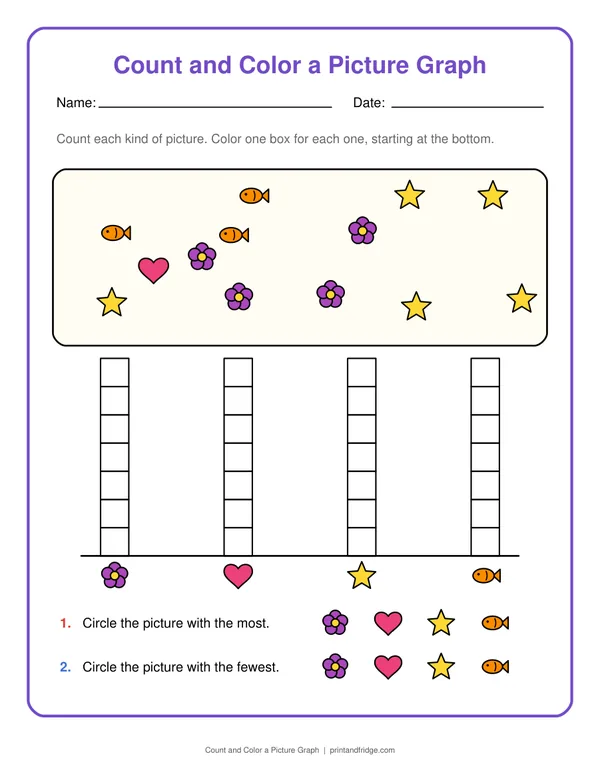
- Read the key of a pictograph before anything else: one picture may stand for 2, 4 or more.
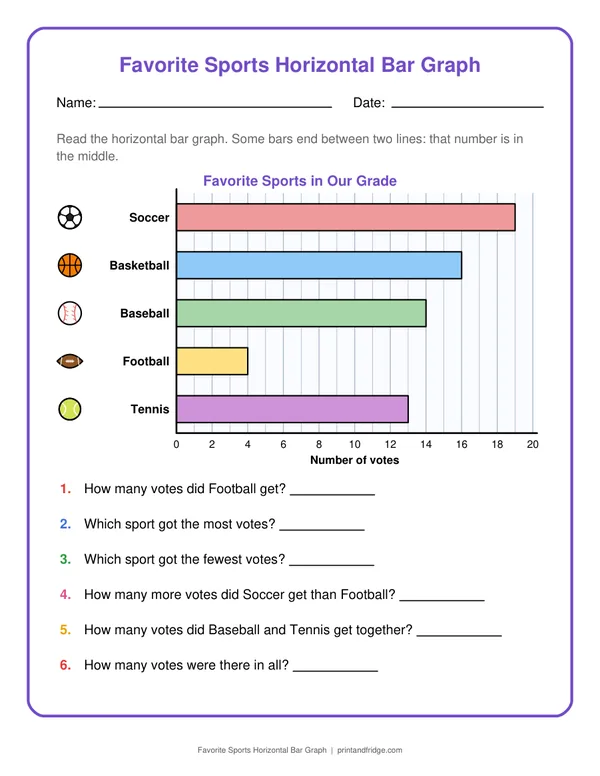
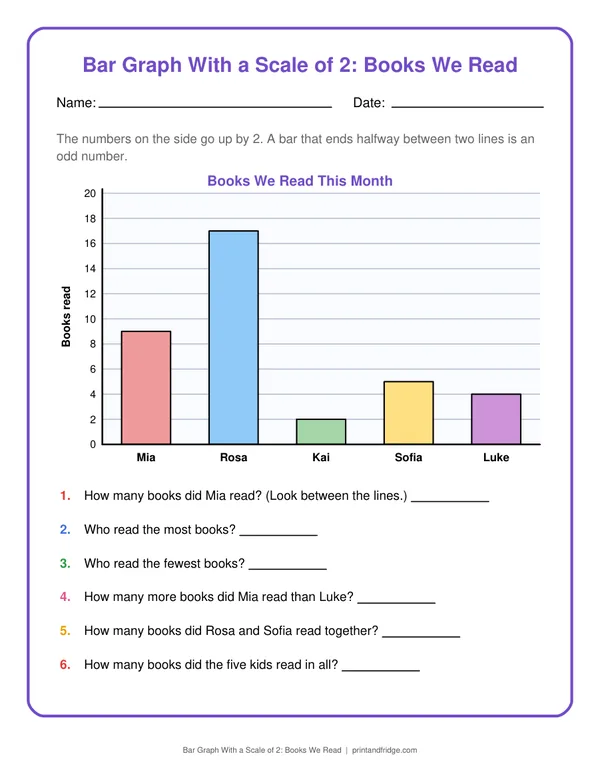
- Check a bar graph by adding all the bars; the total should match the number of votes or days.
Printing tips
Download the PDF and print at 100% (or “fit to page” on A4). Page 1 is the worksheet and page 2 is the answer key with the answers in red; print just page 1 if you want to keep the answers for checking. Free for personal, family and classroom use.
More Graphing Worksheets
See all 19 →