Make a Bar Graph From a Table: Favorite Lunch
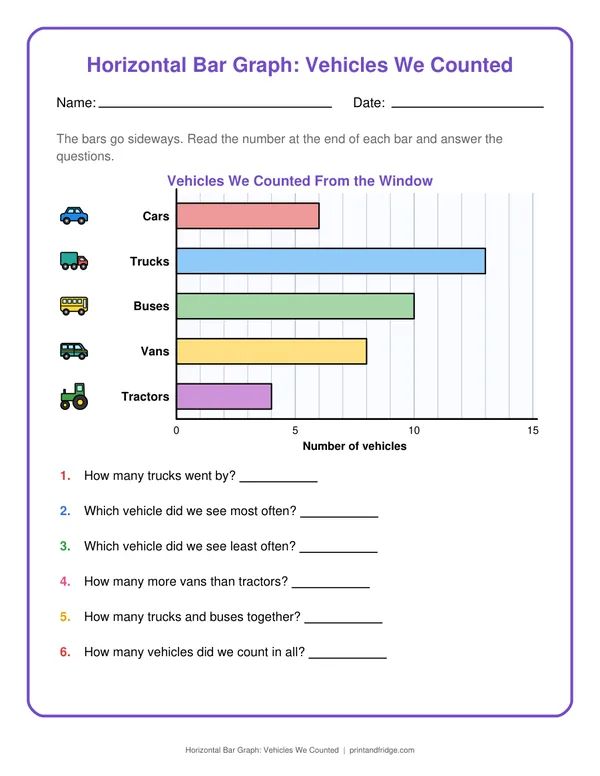
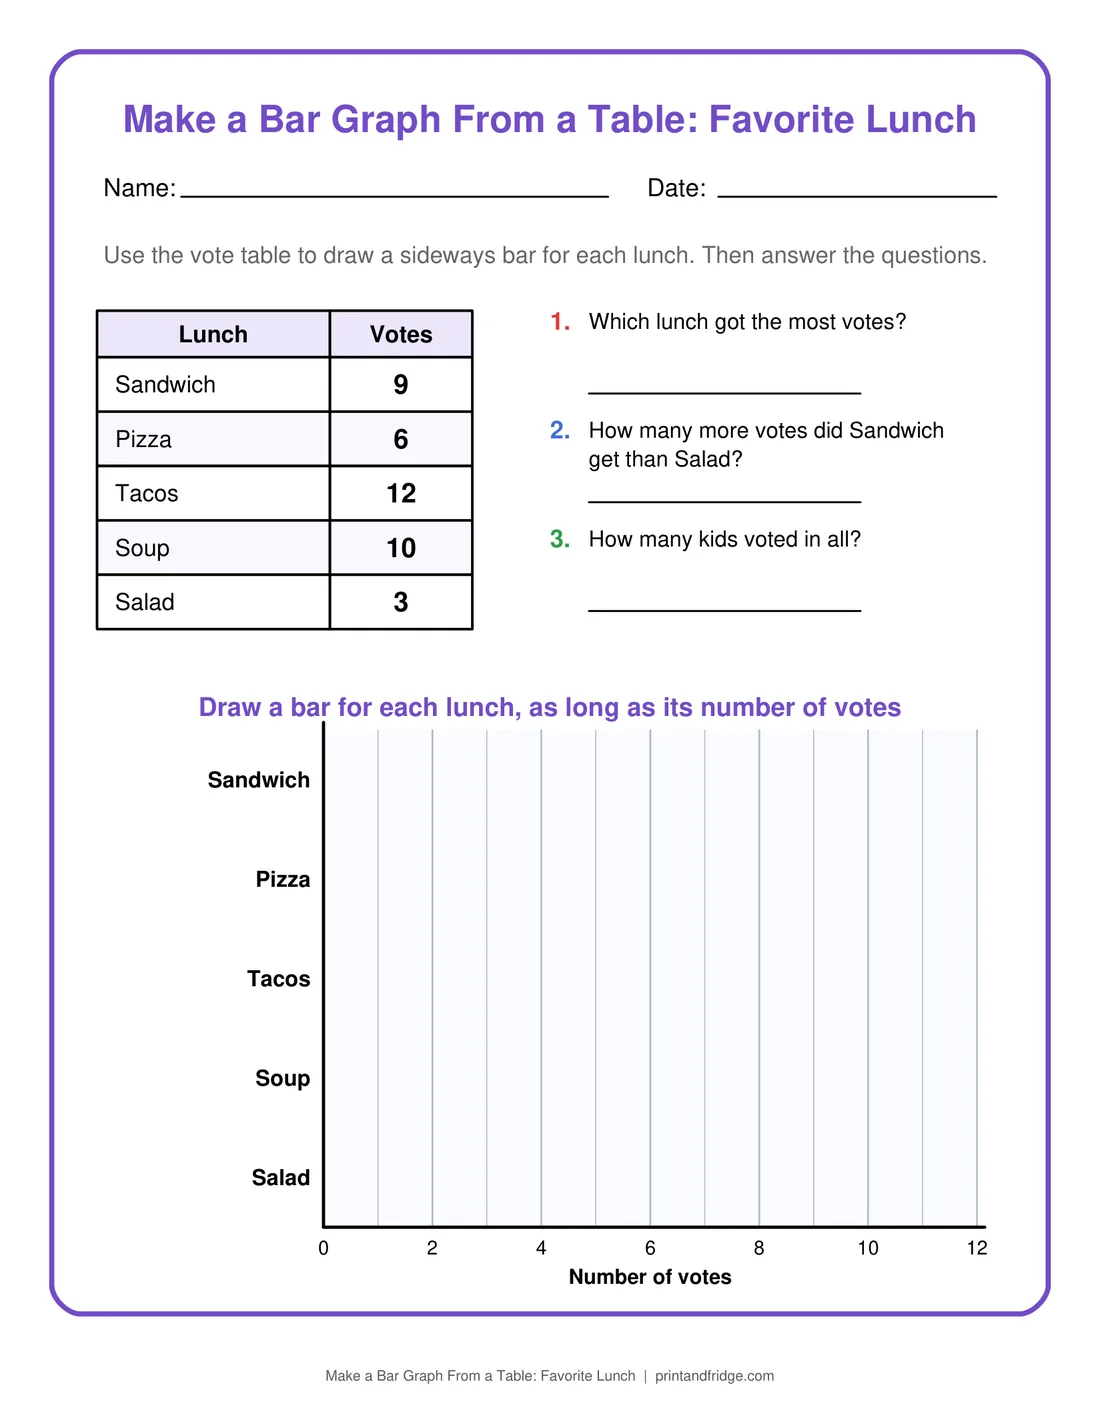
A table of lunch votes to turn into a horizontal bar graph: kids draw each bar to the right length on the grid. Three questions follow, and the key shows the finished graph.
- Size
- US Letter (8.5 × 11 in), fits A4
- 2 pages: the worksheet and its answer key
- Level
- Grade 2
- License
- Free for personal & classroom use
About this worksheet
A table of lunch votes to turn into a horizontal bar graph: kids draw each bar to the right length on the grid. Three questions follow, and the key shows the finished graph. Second graders usually finish it in 10 to 15 minutes.
On this sheet
Lunch Votes Sandwich Pizza Tacos Soup Salad Which lunch got the most votes? How many more votes did Sandwich get than Salad? How many kids voted in all? Draw a bar for each lunch, as long as its number of votes Sandwich Pizza Tacos Soup Salad Number of votes...
Tips for using it
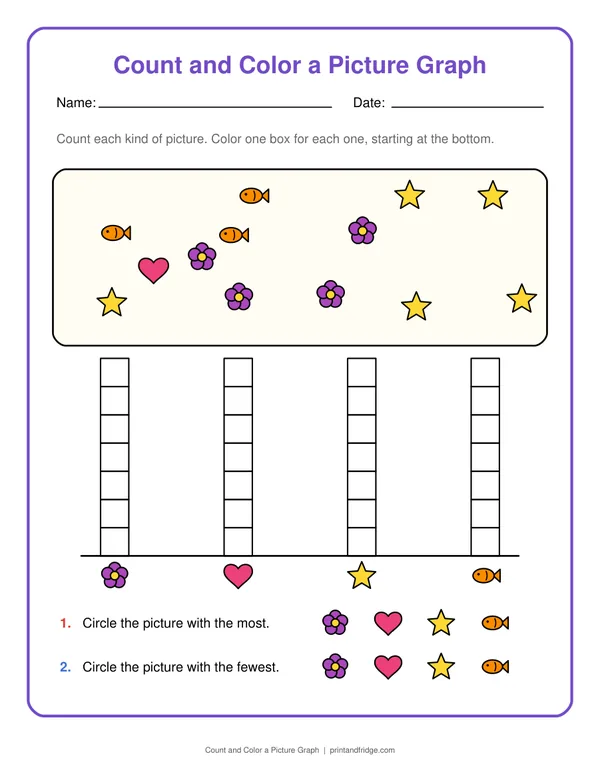
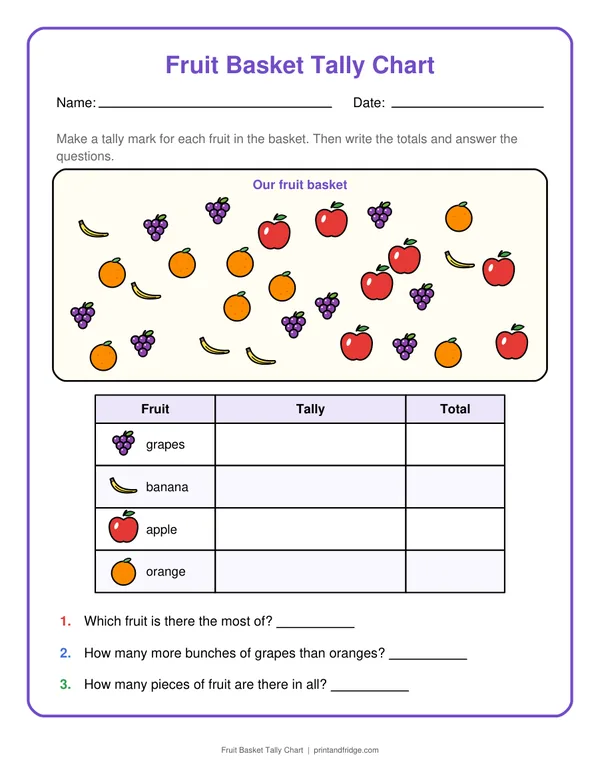
- Cross out each picture as you count it, so nothing is counted twice.
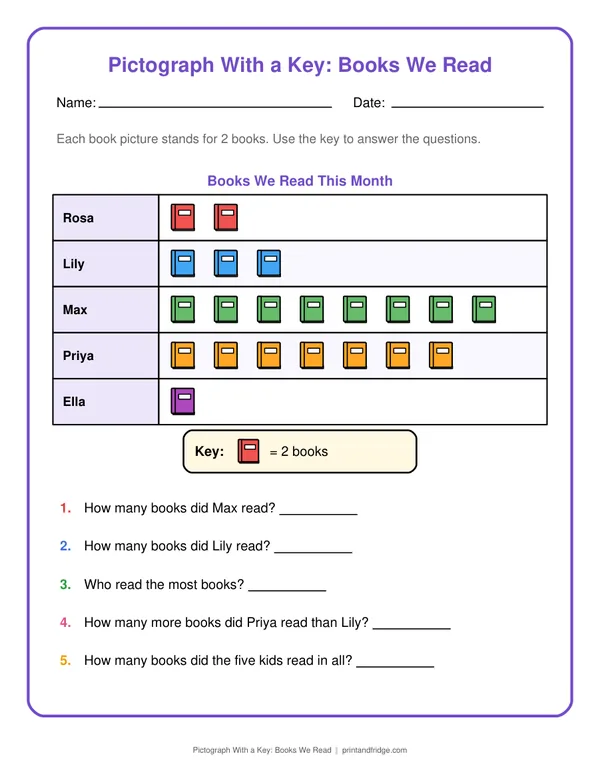
- Read the key of a pictograph before anything else: one picture may stand for 2, 4 or more.
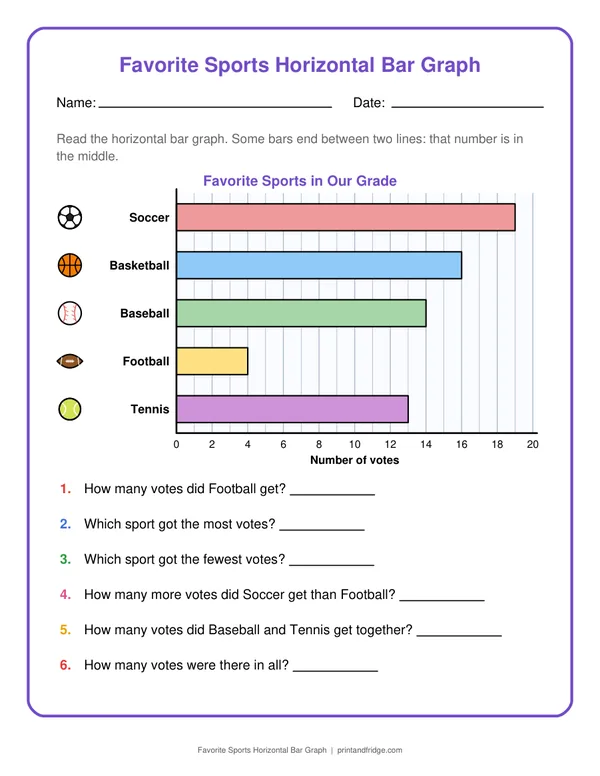
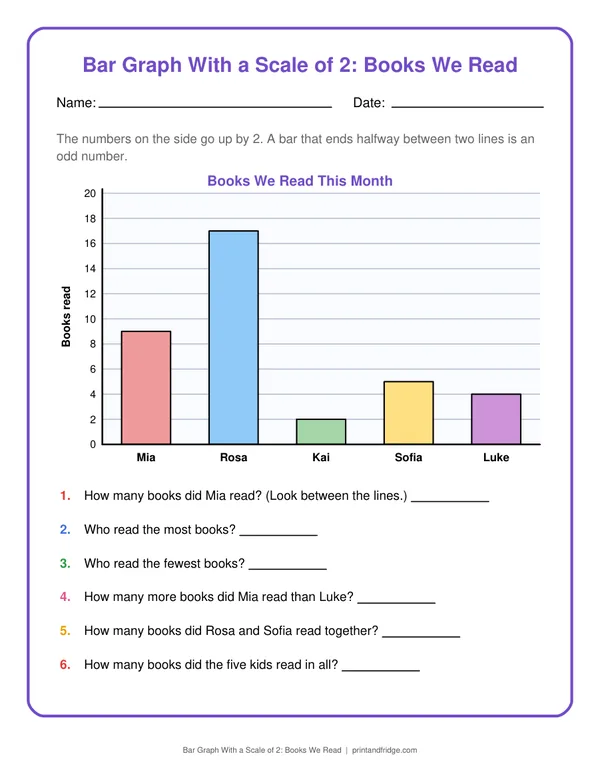
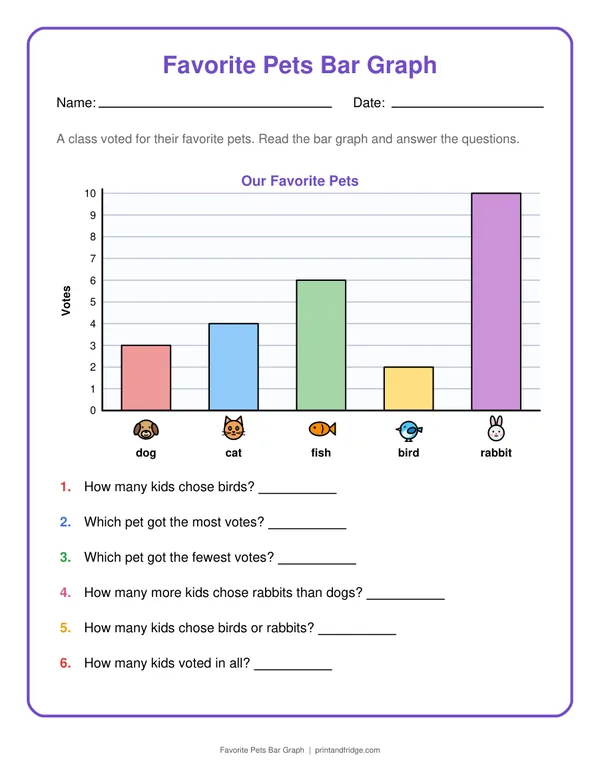
- Check a bar graph by adding all the bars; the total should match the number of votes or days.
Printing tips
Download the PDF and print at 100% (or “fit to page” on A4). Page 1 is the worksheet and page 2 is the answer key with the answers in red; print just page 1 if you want to keep the answers for checking. Free for personal, family and classroom use.
More Graphing Worksheets
See all 19 →