Scale of 10 Bar Graph: Animal Shelter Visitors
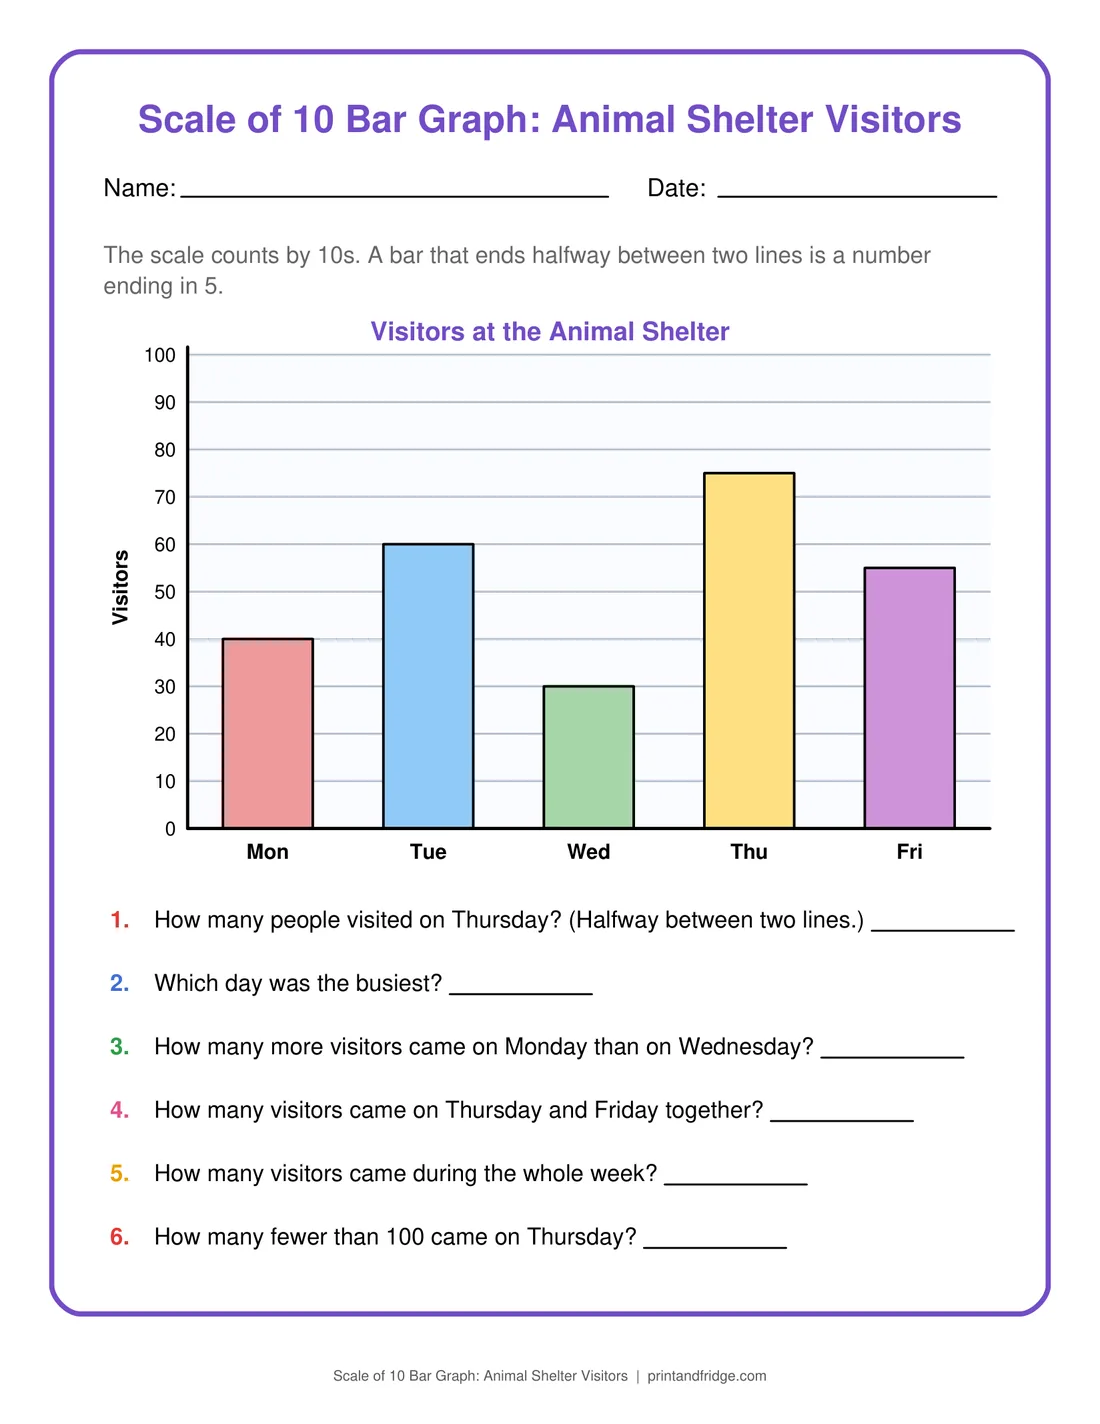
A scale of 10 bar graph: visitors to an animal shelter Monday to Friday (Thursday 75 the busiest, Friday 55, 260 for the week), with 6 questions. Key on page 2.
- Size
- US Letter (8.5 × 11 in), fits A4
- 2 pages: the worksheet and its answer key
- Level
- Grade 3
- License
- Free for personal & classroom use
About this worksheet
The scale runs from 0 to 100 by 10s, and the instruction says a bar ending halfway between two lines is a number ending in 5. Thursday's bar does that at 75, Friday's at 55, Monday had 10 more visitors than Wednesday, and the week totals 260. The six questions include a single bar, the busiest day, a difference, Thursday and Friday together (130), the weekly total and a two-step question: how many fewer than 100 came on Thursday (25). Page 2 gives all six answers. Third graders need about fifteen minutes, and the last question is the one that trips children who stop reading after the number.
On this sheet
ending in 5. Visitors at the Animal Shelter Mon Tue Wed Thu Fri Visitors How many people visited on Thursday? (Halfway between two lines.
Tips for using it
- Have your child write each day's number above its bar, using 5s for the halfway bars.
- Add the five days in two steps: Monday to Wednesday, then Thursday and Friday.
- Ask which two days together had exactly 130 visitors.
- Read question 6 twice and underline fewer than 100 before answering.
Printing tips
Download the PDF and print at 100% (or “fit to page” on A4). Page 1 is the worksheet and page 2 is the answer key with the answers in red; print just page 1 if you want to keep the answers for checking. Free for personal, family and classroom use.
More Graphing Worksheets
See all 19 →