Read a Bar Graph: Fruit We Like Best
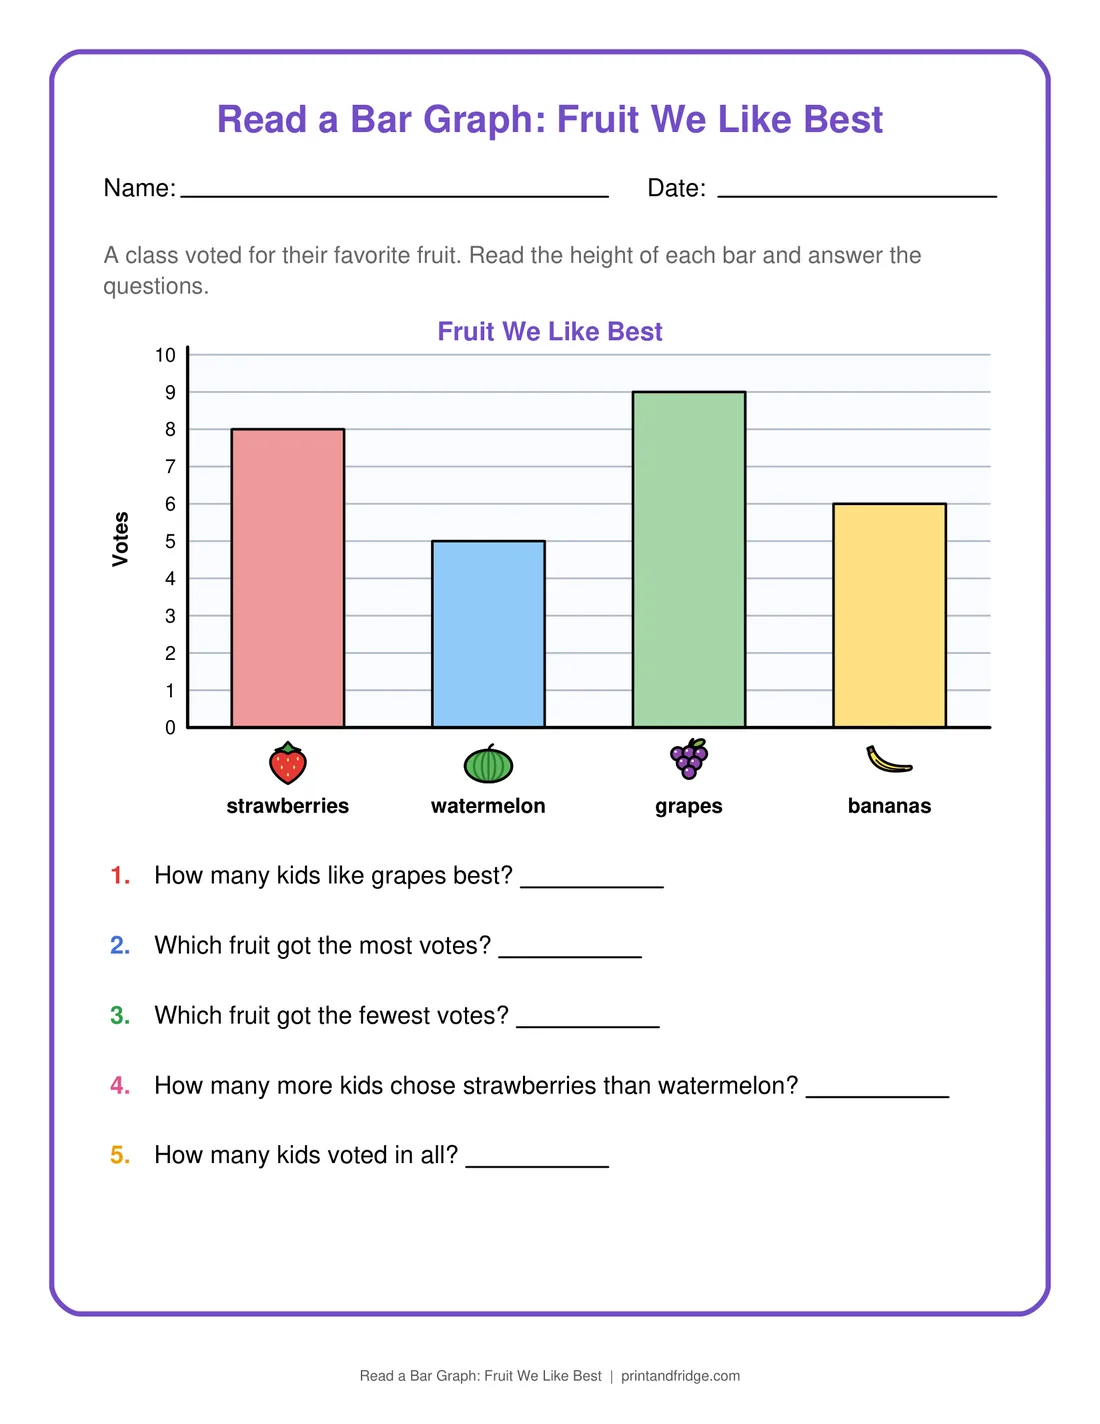
A read a bar graph worksheet for first grade: 4 fruit bars on a scale of 1 (grapes 9 the most, watermelon the fewest, 28 votes in all) with 5 questions.
- Size
- US Letter (8.5 × 11 in), fits A4
- 2 pages: the worksheet and its answer key
- Level
- Grade 1
- License
- Free for personal & classroom use
About this worksheet
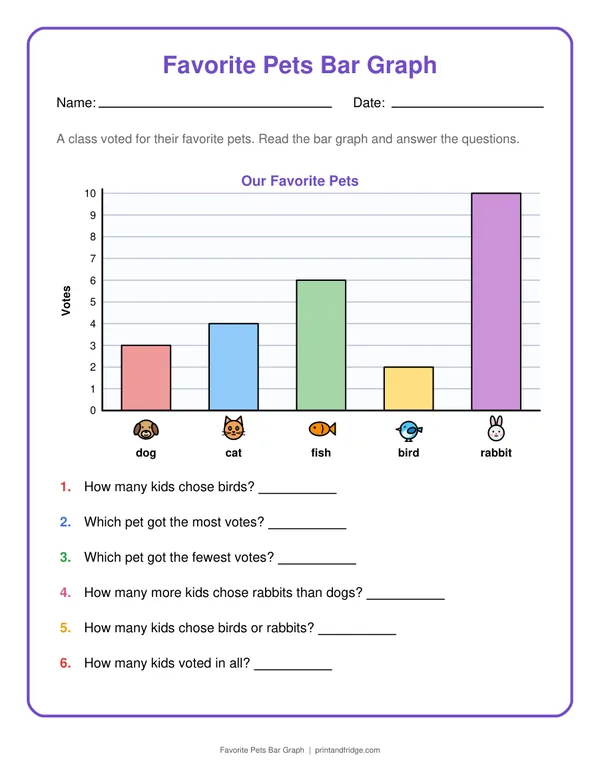
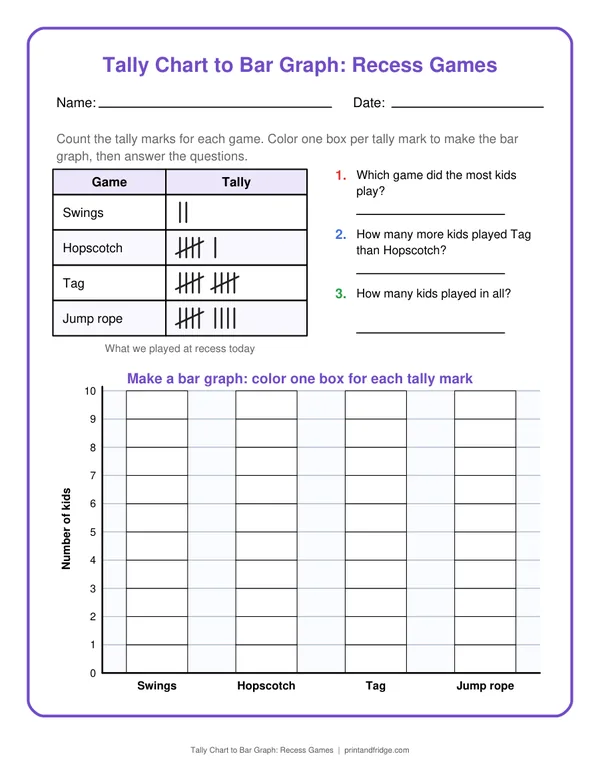
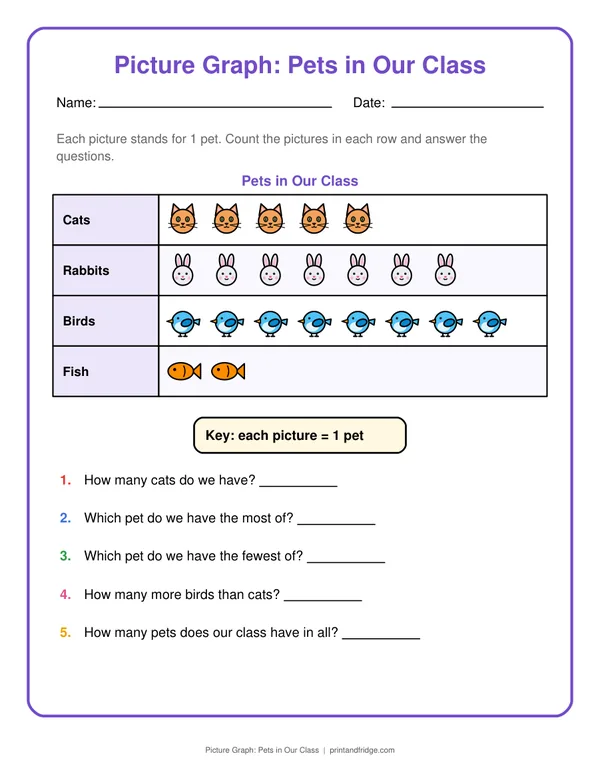
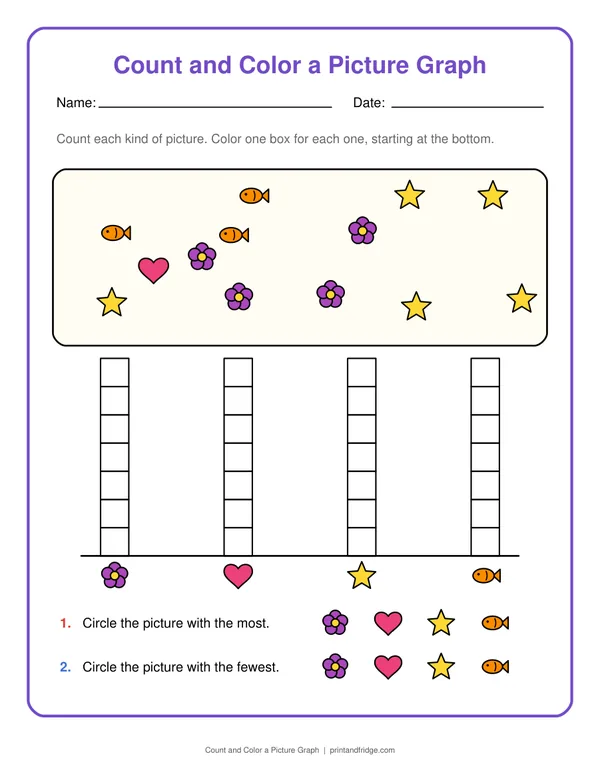
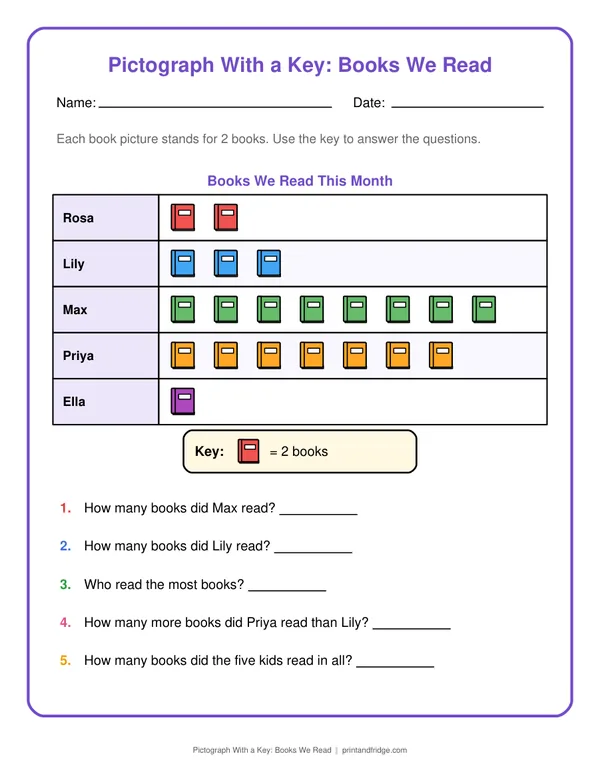
Four bars, each labeled with a picture of the fruit, stand against a scale from 0 to 10: strawberries, watermelon, grapes and bananas. Grapes got the most with 9, watermelon the fewest, strawberries got 3 more than watermelon, and the whole class adds to 28 votes. The five questions follow the usual ladder: one bar, the most, the fewest, a difference and the total. Page 2 gives the five answers. It is a first bar graph page for six-year-olds, about eight minutes, and with only four bars the total is a manageable addition. Tracing the top of each bar across to the number with a finger is the skill.
On this sheet
questions. Fruit We Like Best strawberries watermelon grapes bananas Votes How many kids like grapes best? Which fruit got the most votes? Which fruit got the fewest votes? How many more kids chose strawberries than watermelon? How many kids voted in all?...
Tips for using it
- Have your child slide a finger from the top of each bar to the scale and say the number.
- Write the number above each bar before the questions.
- Ask which two fruits together got the same as the grapes and bananas.
- Vote on the same four fruits at dinner and compare with the class.
Printing tips
Download the PDF and print at 100% (or “fit to page” on A4). Page 1 is the worksheet and page 2 is the answer key with the answers in red; print just page 1 if you want to keep the answers for checking. Free for personal, family and classroom use.
More Graphing Worksheets
See all 19 →