Tally Chart to Bar Graph: Recess Games
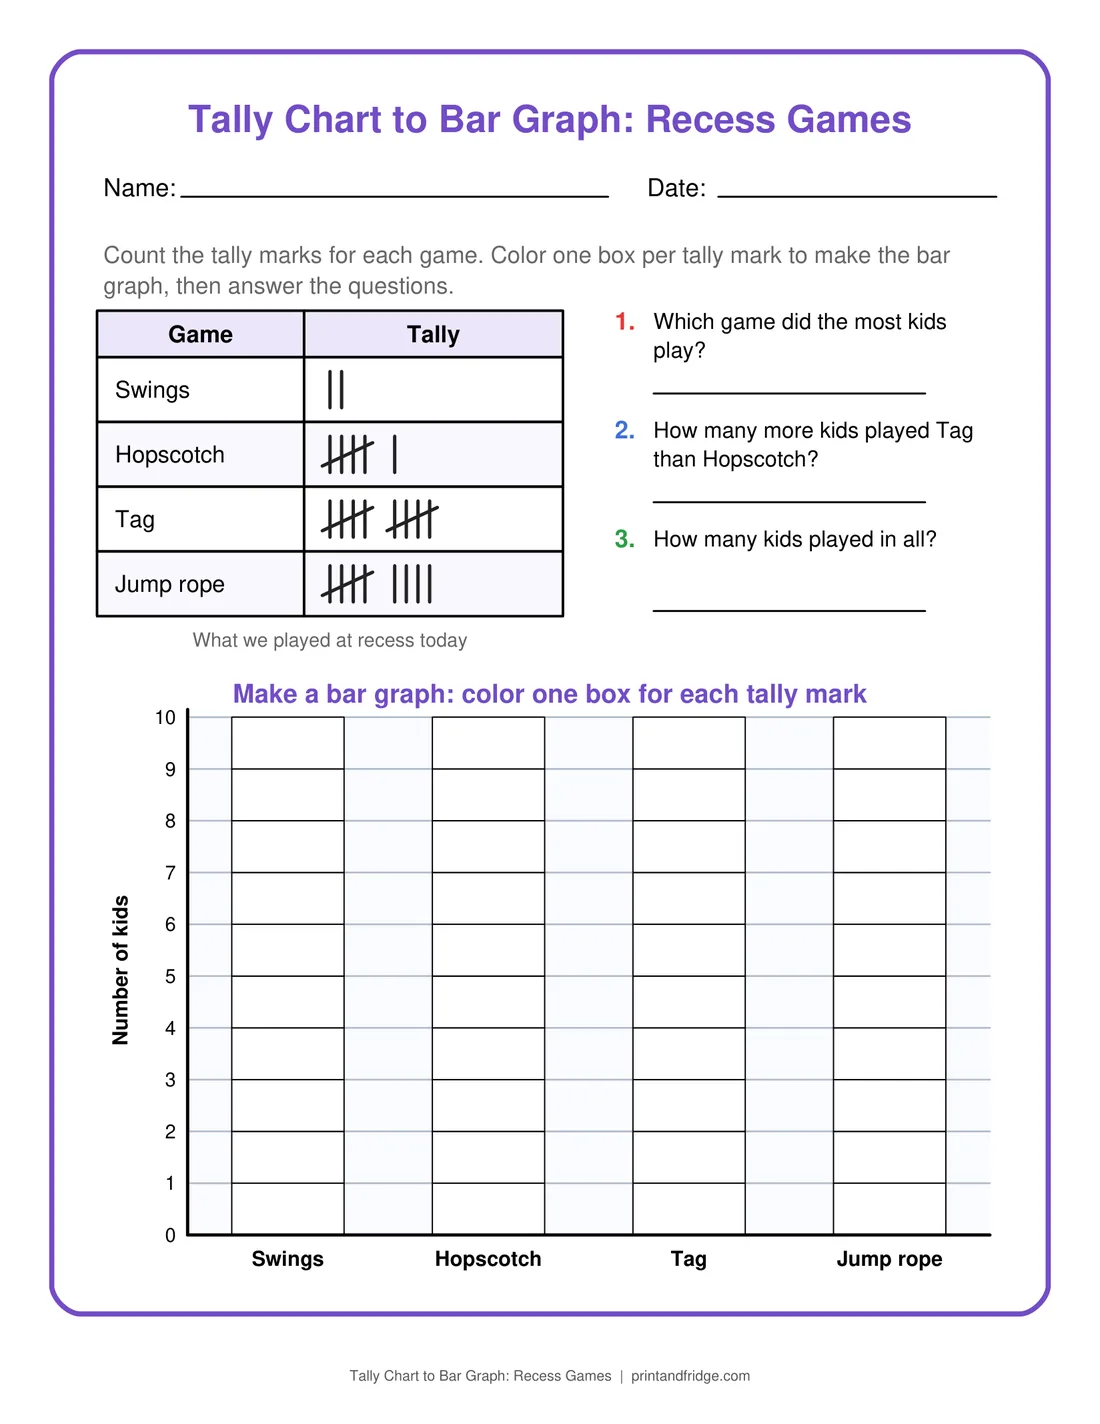
A tally chart to bar graph worksheet: 4 recess games tallied for 27 kids (Tag the most), to color into a bar graph, plus 3 questions. Key on page 2.
- Size
- US Letter (8.5 × 11 in), fits A4
- 2 pages: the worksheet and its answer key
- Level
- Grade 1
- License
- Free for personal & classroom use
About this worksheet
The tally chart lists four games with tally marks for the children who played each, 27 in all, with Tag the most popular and 4 more kids playing Tag than Hopscotch. Under it an empty grid with a scale from 0 to 10 waits for the bars, one colored box per tally mark. The three questions ask for the most played game, the Tag and Hopscotch difference and the total. Page 2 shows the finished bars and answers. First graders need ten to fifteen minutes. Counting tally marks in fives and coloring to exactly that height are two separate skills, and the page gives practice in both.
On this sheet
graph, then answer the questions. Game Tally Swings Hopscotch Tag Jump rope What we played at recess today Which game did the most kids play? How many more kids played Tag than Hopscotch? How many kids played in all? Make a bar graph: color one box for each tally mark Swings Hopscotch Tag Jump rope Number of kids...
Tips for using it
- Have your child write the count beside each tally row, then color that many boxes.
- Color each bar a different color so the comparison is easy to see.
- Check that the four bars together add to 27.
- Ask which game would need 3 more kids to catch up with Tag.
Printing tips
Download the PDF and print at 100% (or “fit to page” on A4). Page 1 is the worksheet and page 2 is the answer key with the answers in red; print just page 1 if you want to keep the answers for checking. Free for personal, family and classroom use.
More Graphing Worksheets
See all 19 →